Future Retirement Success
  • Politics
  • Business
  • Investing
  • Stocks
  • Politics
  • Business
  • Investing
  • Stocks

Future Retirement Success

Stocks

Is this a Dead-Cat Bounce or a Bounce with Legs?

by May 3, 2024
May 3, 2024
Is this a Dead-Cat Bounce or a Bounce with Legs?

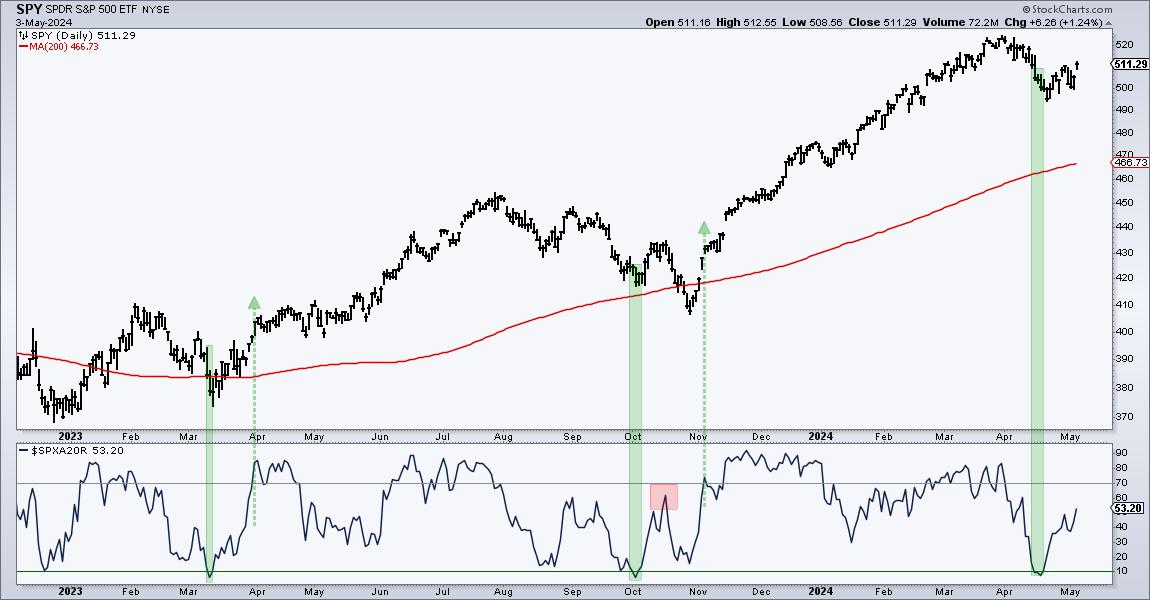
Stocks fell sharply into late April and then rebounded over the last two weeks. SPY fell 5.34% from March 28th to April 19th and then rebounded with a 3.26% gain the last two weeks. Does this bounce have legs? Chartists can separate serious bounces from dead-cat bounces using breadth. Today’s example will use the S&P 500 and the percentage of S&P 500 stocks their 20 day SMAs.  

There are two steps. First, the indicator needs to become oversold (setup). Second, we need to see a significant increase (breakout) in upside participation (signal). An oversold reading signals a significant decline and provides the setup for a bounce. Aggressive traders can trade the oversold condition. A subsequent move above the breakout level signals adequate participation to sustain the advance. Now comes the subjective part. We must choose our oversold and breakout levels. I am choosing 10 and 70 percent for SPX %Above 20-day SMA.

The green shading on the chart above shows when SPX %Above 20-day became oversold and the green arrow-lines mark the subsequent move above 70%. There were setup-signals in March-April and again in October-November. Both led to significant bounces. Notice the red shading where the indicator failed to clear 70% in mid October. This was a feeble bounce and SPY moved to a new low in late October. SPX %Above 20-day then surged above 70% in early November for a signal.  Recently, the indicator became oversold here in mid April for a setup and moved back above 50% this week. An oversold bounce is indeed underway, but I need to see a move above 70% to show a participation breakout.

We are monitoring the rebound in the S&P 500 and Nasdaq 100 at TrendInvestorPro (ChartTrader). Our 10 indicator composite indicator became oversold in mid April, but we have yet to see the required breadth thrust to signal a strong increase in participation. ChartTrader reports and videos provide broad market timing signals and trading setups for leading stocks and ETFs. This week we featured setups in the T-Bond ETF (TLT), the Biotech SPDR (XBI) and four Tech ETFs (IGV, SOXX, CIBR, SKYY). Click here for immediate access.

//////////////////////////////////////////////////

0
FacebookTwitterGoogle +Pinterest
previous post
The Bull Case for Buffett’s Biggest Holding
next post
Technology Stocks Back In the Lead: Are Inflation Fears Behind Us?

You may also like

Coming Up Aces in Clean Energy

September 17, 2022

The Most Efficient Way To Follow The Markets...

May 17, 2024

Trade War Panic: Are International Stocks the Safer...

March 4, 2025

Granddad Russell 2000 Leads This Stock Rally

October 27, 2022

Home Construction ETF Breaks and a Home Builder...

October 18, 2023

DP Trading Room: On-Balance Volume (OBV) Explained

April 1, 2024

Be Ready for the Next Bull Market, Part...

November 16, 2022

Chop Going Into CPI and FOMC

December 9, 2022

2-Year Business Cycles Matter in This Market

February 8, 2023

Gold Is Doing Great!

May 17, 2024

    Get free access to all of the retirement secrets and income strategies from our experts! or Join The Exclusive Subscription Today And Get the Premium Articles Acess for Free

    By opting in you agree to receive emails from us and our affiliates. Your information is secure and your privacy is protected.

    Recent Posts

    • Trump appointee Barrett challenges administration on nationwide injunctions, surprises and delights liberals

      May 16, 2025
    • Senators sound off as Supreme Court hears case on nationwide injunctions

      May 16, 2025
    • Israel turns tables on UN official claiming ‘genocide’ in Gaza with basic questions

      May 16, 2025
    • Handful of Republicans sink Trump’s ‘big, beautiful bill’ in key House committee

      May 16, 2025
    • SPY and QQQ Recapture their 200-day SMAs – Tips for Reducing Whipsaws and Improving Performance

      May 16, 2025
    • Applying Dow Theory to Today’s Market: Are We in a Reversal or a New Trend?

      May 16, 2025

    Categories

    • Business (7,974)
    • Investing (1,965)
    • Politics (15,253)
    • Stocks (3,087)
    • About us
    • Privacy Policy
    • Terms & Conditions

    Disclaimer: futureretirementsuccess.com, its managers, its employees, and assigns (collectively “The Company”) do not make any guarantee or warranty about what is advertised above. Information provided by this website is for research purposes only and should not be considered as personalized financial advice. The Company is not affiliated with, nor does it receive compensation from, any specific security. The Company is not registered or licensed by any governing body in any jurisdiction to give investing advice or provide investment recommendation. Any investments recommended here should be taken into consideration only after consulting with your investment advisor and after reviewing the prospectus or financial statements of the company.

    Copyright © 2025 futureretirementsuccess.com | All Rights Reserved