Future Retirement Success
  • Politics
  • Business
  • Investing
  • Stocks
  • Politics
  • Business
  • Investing
  • Stocks

Future Retirement Success

Investing

Government Debt Varies Widely by State

by July 19, 2024
July 19, 2024
Government Debt Varies Widely by State

Chris Edwards, Marc Joffe, and Krit Chanwong

Without reforms, exploding federal debt will generate a major economic crisis. Technically, the solution to the problem is simple (cut spending), but there is no consensus on what political approach or legal mechanisms are needed to avert the coming crisis.

What can we learn from state governments about controlling debt? We should be able to learn something because debt levels vary widely, as do unfunded liabilities for state worker pensions and other post-employment benefits (OPEB).

For each state, the map shows the sum of state bond debt, unfunded pensions, and unfunded OPEB as a percentage of state gross domestic product (GDP) in 2022. All three types of liability impose risks and costs on future taxpayers.

The data are from Truth in Accounting and include state-level liabilities, but not local liabilities.

The differences between the lowest and highest states are huge. The lowest-liability states—Arizona, Idaho, Nebraska, Tennessee, Utah, Wisconsin, and Wyoming—owe less than 3 percent of GDP. The highest-liability states—Connecticut, Hawaii, Illinois, New Jersey, and Vermont—owe more than 20 percent of GDP.

Most states use a variety of legal mechanisms to limit bond debt, including limits on debt outstanding, debt servicing costs, and debt issuance. However, there are also large differences in unfunded pension and OPEB obligations between the states, which are not controlled by the rules on bond debt.

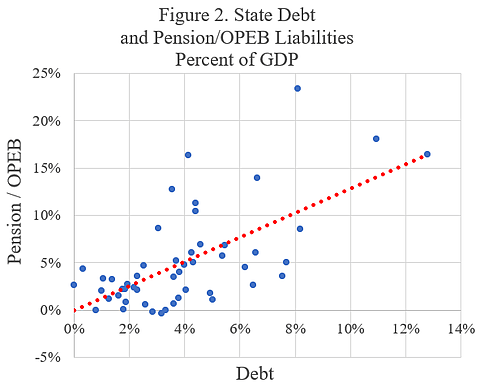
Furthermore, there are similar patterns across the states for debt, pension liabilities, and OPEB liabilities. For example, New Jersey is far above average for all three types of liability, while Nebraska is far below average for all three types. Figure 2 shows the strong statistical correlation between debt on the horizontal axis and the sum of unfunded pensions and OPEB on the vertical axis. Each dot is a state.

The three dots in the top-right are New Jersey, Connecticut, and Hawaii. Those states are much higher for all three types of liability, while Nebraska is near zero for all three types. When thinking about how to tackle exploding federal debt, we should look to budgeting practices in states like Nebraska, not New Jersey.

We don’t know all the reasons for the large liability differences between the states, but political party does seem to play a role. Figure 3 compares the sum of the three types of state liability to the percent of seats in each state’s legislature that are held by Republicans. States with more Republicans tend to have lower liabilities as a percentage of GDP.

However, party is only one of many factors. Note, for example, that at the 35 percent Republican legislator level, state liabilities range from 3.9 percent (in Nevada) to 29 percent (in Connecticut).

In sum, state differences in debt and unfunded pension and OPEB are large. Understanding the causes of these differences may help us tackle the rising debt threat from the legislators of both parties in Washington, DC. 

0
FacebookTwitterGoogle +Pinterest
previous post
The Impact of Economic Changes on Commercial Mortgages
next post
Five more House Democrats call on Biden to drop out, third US senator

You may also like

Dulles Airport Metro Extension Not Paying Off

November 1, 2023

The Trump Administration’s Eggstremely Interesting Fix for High...

February 26, 2025

What Else Was Trending in State Technology and...

August 18, 2023

Navigating the Future of International Taxation: A New...

February 13, 2024

One Year of Javier Milei

December 11, 2024

Biden’s New Sanctions are Unlikely to Meet His...

February 23, 2024

On Libertarians, Trade Policy, and National Security

June 21, 2024

New Zealand’s Free Market Farming

August 21, 2023

Affirmative Action in College Admissions

May 30, 2023

The Government Doesn’t Want You Using Cash

June 28, 2024

    Get free access to all of the retirement secrets and income strategies from our experts! or Join The Exclusive Subscription Today And Get the Premium Articles Acess for Free

    By opting in you agree to receive emails from us and our affiliates. Your information is secure and your privacy is protected.

    Recent Posts

    • The real breakthrough in U.S.–China trade talks is much bigger than just tariffs

      May 15, 2025
    • Dem senator says ‘no doubt’ Biden declined cognitively during presidency

      May 15, 2025
    • Trump makes historic UAE visit as first US president in nearly 30 years

      May 15, 2025
    • GOP reps, advocacy group to target competitive House districts in Trump tax-cut push

      May 15, 2025
    • Biden’s pandemic playbook failed. Trump just offered a smarter path forward

      May 15, 2025
    • MP launches bill to make polluters pay for climate damage and resilience

      May 15, 2025

    Categories

    • Business (7,966)
    • Investing (1,959)
    • Politics (15,230)
    • Stocks (3,084)
    • About us
    • Privacy Policy
    • Terms & Conditions

    Disclaimer: futureretirementsuccess.com, its managers, its employees, and assigns (collectively “The Company”) do not make any guarantee or warranty about what is advertised above. Information provided by this website is for research purposes only and should not be considered as personalized financial advice. The Company is not affiliated with, nor does it receive compensation from, any specific security. The Company is not registered or licensed by any governing body in any jurisdiction to give investing advice or provide investment recommendation. Any investments recommended here should be taken into consideration only after consulting with your investment advisor and after reviewing the prospectus or financial statements of the company.

    Copyright © 2025 futureretirementsuccess.com | All Rights Reserved