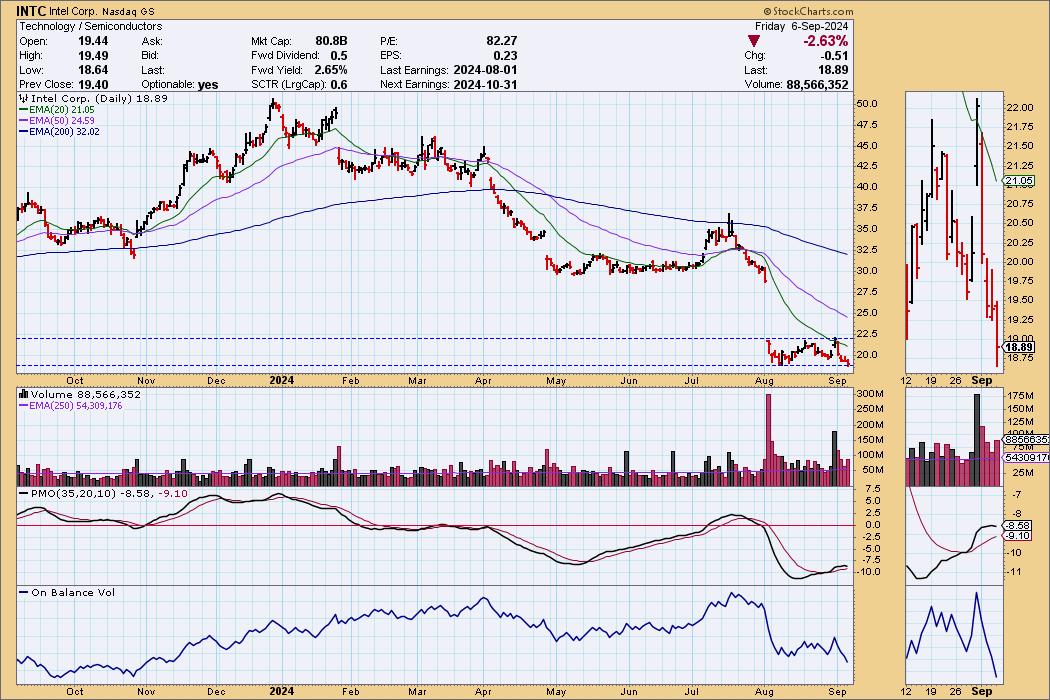
I’ve been around long enough to remember when Intel (INTC) was the NVIDIA of the day. Now INTC is under severe pressure, having suspended its dividend, and currently being considered for removal from the Dow 30 Industrial Average. Oh, how the mighty have fallen! With INTC having declined so much, we wonder if it is time to be bargain hunting this stock. Let’s look at charts in three time frames to find the answer.
The daily chart below shows it making new 52-week lows today. The daily PMO was rising above the signal line, but it has turned down, and the PMO is deeply below the zero line. INTC has been in a narrow trading range for about a month. If it were to break up out of that range, it might be considered as a buy candidate, but for now it doesn’t look promising.
The weekly chart doesn’t look any more promising. We can see that a line of support has been violated, and that the weekly PMO is falling well below the zero line. No encouragement here.
Finally, the monthly chart shows that a very long-term support line has been violated, and the monthly PMO is falling below the zero line. INTC has just entered a zone of congestion wherein it may find support, but the potential is for price to fall to 7.50.
Conclusion: So, to answer our initial question, no, there are no signs in any of the three time frames that now is the time to be buying this stock. Probably the first sign that it may be time to consider an entry would be when the daily PMO turns up, accompanied by positive price action. Gradually adding to the position could take place as we see similar signs in the weekly and monthly time frames.
Introducing the new Scan Alert System!
Delivered to your email box at the end of the market day. You’ll get the results of our proprietary scans that Erin uses to pick her “Diamonds in the Rough” for the DecisionPoint Diamonds Report. Get all of the results and see which ones you like best! Only $29/month! Or, use our free trial to try it out for two weeks using coupon code: DPTRIAL2. Click HERE to subscribe NOW!
Learn more about DecisionPoint.com:
Watch the latest episode of the DecisionPointTrading Room on DP’s YouTube channel here!
Try us out for two weeks with a trial subscription!
Use coupon code: DPTRIAL2 Subscribe HERE!
Technical Analysis is a windsock, not a crystal ball. –Carl Swenlin
(c) Copyright 2024 DecisionPoint.com
Disclaimer: This blog is for educational purposes only and should not be construed as financial advice. The ideas and strategies should never be used without first assessing your own personal and financial situation, or without consulting a financial professional. Any opinions expressed herein are solely those of the author, and do not in any way represent the views or opinions of any other person or entity.
DecisionPoint is not a registered investment advisor. Investment and trading decisions are solely your responsibility. DecisionPoint newsletters, blogs or website materials should NOT be interpreted as a recommendation or solicitation to buy or sell any security or to take any specific action.
Helpful DecisionPoint Links:
Trend Models
Price Momentum Oscillator (PMO)
On Balance Volume
Swenlin Trading Oscillators (STO-B and STO-V)
ITBM and ITVM
SCTR Ranking
Bear Market Rules

