Future Retirement Success
  • Politics
  • Business
  • Investing
  • Stocks
  • Politics
  • Business
  • Investing
  • Stocks

Future Retirement Success

Stocks

Market Pullbacks Provide Opportunities to Build your WatchList – Here’s How

by January 11, 2025
January 11, 2025
Market Pullbacks Provide Opportunities to Build your WatchList – Here’s How

The stock market is in pullback mode with the S&P 500 EW ETF down 5.15% over the past month and down 1% year-to-date. This makes it a good time to monitor relative performance and create a relative strength watch list. Stocks and ETFs holding up best during pullbacks often lead when the market regains its footing. Today’s report will show a starter list and analyze the chart for an AI Robotics ETF.

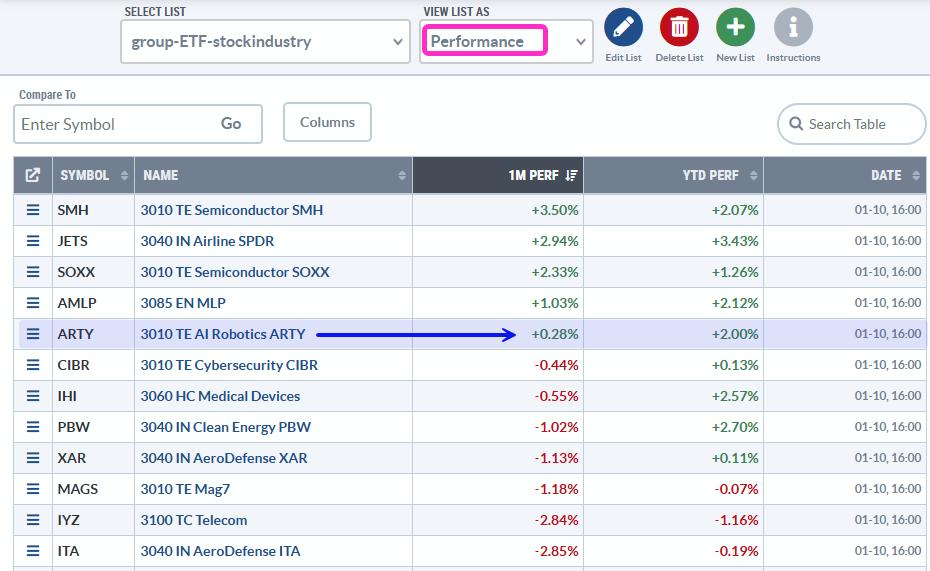
The table below shows 1-month and year-to-date performance for a selection of industry group ETFs. With the S&P 500 EW ETF down on both timeframes, ETFs with gains are holding up well and ETFs with smaller losses show relative strength (less weakness). Five ETFs are up on both timeframes and holding up well in the face of broad market weakness.

Note that this list is simply the first cut. I would make a further cut by insuring that the ETF is in a long-term uptrend. For example, the Clean Energy ETF (PBW) is below its 200-day SMA and would not make the cut. The Medical Devices ETF (IHI) and Robotics AI ETF (ARTY) are in long-term uptrends, and make the cut. Let’s look at ARTY. A recent Chart Trader report/video highlighted the recent breakout in IHI.

The chart below shows ARTY hitting a new high in early December and price above the rising 200-day SMA. ARTY is in a long-term uptrend. There was a big breakout in mid October, an oversold reading in late October and then a 17% run to new highs. ARTY then formed a pennant and broke out with a surge earlier this week, only to fall back the last three days. Overall, I think the pennant breakout is still bullish and this is a throwback to the breakout zone. A break below the pennant lows would negate this pattern and argue for a deeper correction.

The middle window shows the price-relative (ARTY/RSP Ratio) breaking above its 200-day SMA in late November. ARTY shows relative strength and the price-relative hit a new high in early January. The lower window shows %B, which I use to identify oversold conditions within an uptrend. A dip below 0 means the close is below the lower Bollinger Band. This means there was a pullback within the uptrend, which is an opportunity.

I will be following ARTY and other leading ETFs closely in the Chart Trader reports and videos. Our reports warned of the breakout in the 10-yr Treasury Yield in before Christmas (HERE) and we also showed how to distinguish between a robust bounce and a dead cat bounce (HERE).

Click here to take Chart Trader trial and get immediate access.

//////////////////////////////////////////////////

0
FacebookTwitterGoogle +Pinterest
previous post
Chancellor heads to China in search of growth amid surging borrowing costs
next post
Week Ahead: NIFTY Steps Into Next Week With These Two Negative Technical Developments

You may also like

Strong Rotation To Value Stocks

November 1, 2022

Be Ready for the Next Bull Market

November 9, 2022

This MUST SEE MACD Pattern is a Game...

May 29, 2024

GNG TV: “Building” Go Trends in US Equities

May 18, 2023

Setups That I Like Right Now

April 30, 2023

Is Aflac Set to Surpass Analysts’ Targets? Find...

May 31, 2024

Power Charting TV: Stock Selection with the Wyckoff...

August 5, 2023

AMD Plunges to a Critical Support Level: Is...

April 16, 2024

Beware of Shorts in EXTREME Cycle Lows For...

September 29, 2023

S&P 500 Breakdown Alert! Downside Targets Explained

January 10, 2025

    Get free access to all of the retirement secrets and income strategies from our experts! or Join The Exclusive Subscription Today And Get the Premium Articles Acess for Free

    By opting in you agree to receive emails from us and our affiliates. Your information is secure and your privacy is protected.

    Recent Posts

    • MP launches bill to make polluters pay for climate damage and resilience

      May 15, 2025
    • HMRC issues first individual tax avoidance Stop Notices to former solicitor Paul Baxendale-Walker

      May 15, 2025
    • UK economy posts strongest growth in a year, driven by exports and business investment

      May 15, 2025
    • EIS investments fall sharply despite tax breaks, raising concerns over regional imbalance and complexity

      May 15, 2025
    • University of Hull launches Railwhere to drive innovation in rail freight efficiency

      May 15, 2025
    • Bank of London under investigation by PRA amid financial uncertainty and governance overhaul

      May 15, 2025

    Categories

    • Business (7,966)
    • Investing (1,959)
    • Politics (15,225)
    • Stocks (3,084)
    • About us
    • Privacy Policy
    • Terms & Conditions

    Disclaimer: futureretirementsuccess.com, its managers, its employees, and assigns (collectively “The Company”) do not make any guarantee or warranty about what is advertised above. Information provided by this website is for research purposes only and should not be considered as personalized financial advice. The Company is not affiliated with, nor does it receive compensation from, any specific security. The Company is not registered or licensed by any governing body in any jurisdiction to give investing advice or provide investment recommendation. Any investments recommended here should be taken into consideration only after consulting with your investment advisor and after reviewing the prospectus or financial statements of the company.

    Copyright © 2025 futureretirementsuccess.com | All Rights Reserved