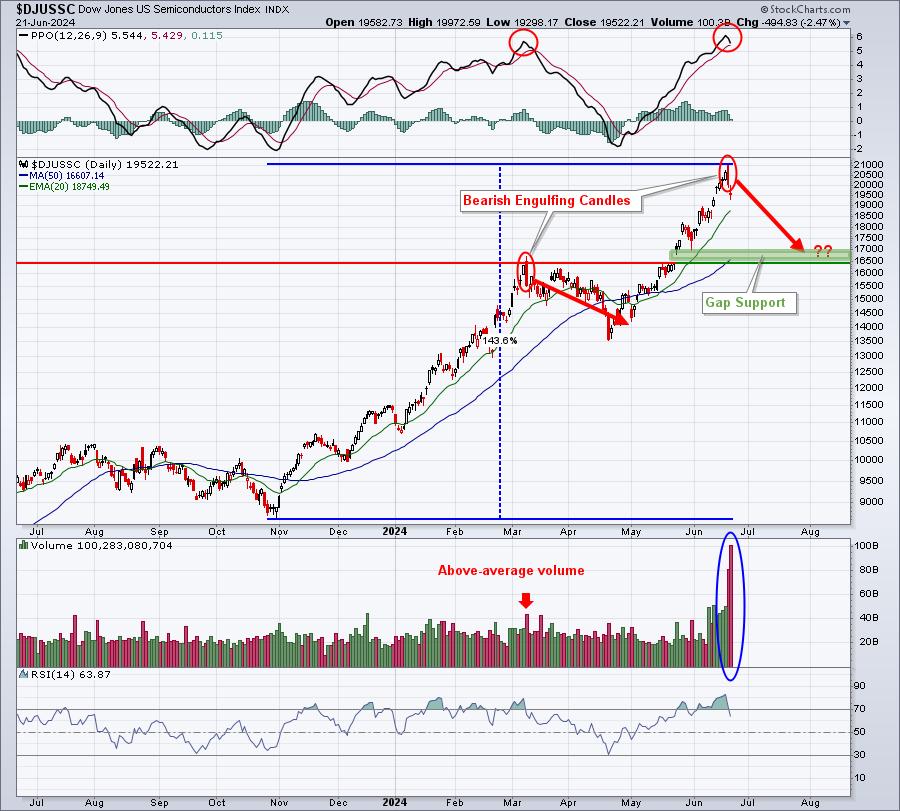
Extremely heavy volume that accompanies a gap higher and a reversing candle after a lengthy uptrend is typically a sign of buyers’ exhaustion and a much more aggressive group of sellers. The longer and more impressive the rally leading up to the reversal, the more likely the top may last for a significant period of time. Check out the daily chart Friday on the Dow Jones U.S. Semiconductors Index ($DJUSSC):
I wrote about this group in our Friday EarningsBeats Digest newsletter and declared a short-term top, possibly even an intermediate-term group. A seasonality chart that backs up a possible fall based on technical data is as follows:
This seasonality chart covers the past 12 years, or since 2013, and it’s a relative chart – illustrating how the semiconductors perform RELATIVE to the S&P 500. 2013 is the year that this secular bull market began and semiconductors have been a HUGE reason why the last dozen years have been so strong. If you look closely at this seasonality chart, you’ll see a pattern where this group LOVES the second month of each calendar quarter. The stock market itself tends to perform best in the first month of calendar quarters. Semiconductors are different, however, and the following illustrates this point:
Relative Performance of Semiconductors By Month of Calendar Quarter
Month 1 (January, April, July, October): -1.0%Month 2 (February, May, August, November): +13.3%Month 3 (March, June, September, December): +3.4%
Care to guess when you should consider being overweight semiconductors? Hopefully, it’s obvious.
NVIDIA Corp (NVDA) is the primary leader in semiconductors and here’s its seasonal performance since 2013:
Keep in mind that this seasonal chart is based on NVDA’s absolute price performance, not relative. Here’s the NVDA breakdown by months of calendar quarters:
Month 1 (January, April, July, October): +16.2%Month 2 (February, May, August, November): +40.2%Month 3 (March, June, September, December): +6.9%
My rationale for the strong semiconductor performance in second months within calendar quarters is that NVDA typically reports earnings in the second month of calendar quarters. For example, NVDA reports its next earnings on August 21st (2nd month in Q3). The pre-earnings moves to the upside occur later for NVDA than many other stocks, because others tend to report their results in the first months or very early in the second months of calendar quarters. Therefore, the timing of accumulation can be quite different.
In my opinion, the semiconductor trade is WAAAAAAY too crowded now. I’ve made money there and am now planning to stay away. Instead, I’m going to focus on areas showing strength that also perform well during the first months of calendar quarters. After all, July is the first month of Q3 and it’s rapidly approaching. As money rotates away from semiconductors, there’ll be a ton of money finding a new home.
Opportunity Ahead
I firmly believe that the current secular bull market isn’t going to end. Instead, as semiconductors weaken, other areas will step up to help carry the load. One sector, somewhat forgotten currently, has generated nearly all its gains over the past 20 years from the first months of calendar quarters. And one stock within the sector LOVES the month of July, rising 14 of the last 15 years and producing an average July return of 5.6% over the past 15 years. I see a big month ahead and will be providing the stock Monday in our FREE EB Digest newsletter. If you’re not already an EBD subscriber, CLICK HERE to start your subscription for FREE (no credit card required) and receive the stock on Monday.
Also, for more trading ideas ahead as money rotates, please review my Weekly Market Recap video at YouTube this weekend, “Semiconductors See A Euphoric Top, Opposite George Week Works Again!”.
Happy trading!
Tom

